Hey Traders,
Take a step back for a second.
What’s happening right now in the market?
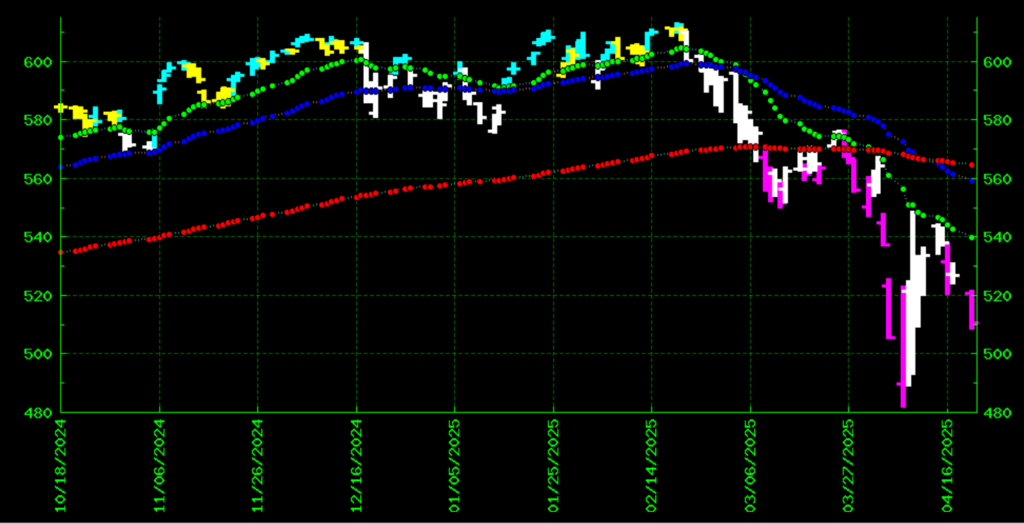
Here’s a SPY chart. Take a look at it and think about what you see:
Is it chaos? Is it crazy? Is it unpredictable?
Nope.
It’s just a downtrend… doing its job.
Think about it:
- 7 straight weeks of downward pressure
- Every bounce attempt smacked down by the 20-day moving average
- A 10% rally day on April 9th — one of the biggest ever — and still, no real breakout… no followthrough.
- Another rally attempt — bumped its head again and rolled right back over
This is not chaos.
If you stop to think about it, this is exactly what you expect when the ceiling’s coming down!
(If you missed it, I broke this down last week)
The news will try to tell you it’s random.
Social media will tell you it’s rigged.
Hopeful traders will tell you “this time is different.”
But the chart?
The chart says: downtrend intact, resistance overhead, game on.
This is what a real downtrend looks like.
Not a straight shot down… Not a freefall every day.
Just a series of lower highs, weaker bounces, and slowly tightening pressure — until the floor cracks again.
And the best part?
When you know how to spot it — and how to trade it — you’re not scared of it.
You’re waiting for it.
That’s exactly what I’m doing right now — and for the past 7 weeks…
And it’s exactly why I’ve stayed bearish even when the crowd was cheering those one-off green candle days.
The trend is still doing its job.
Are you doing yours?
Trade well,
Jack Carter
P.S. TSLA reports earnings tomorrow… and it could rock the entire market. Here’s my right way to play it: All the details right here.