
Hey Traders,
Let’s rewind for a second.
Over the past 6 or so weeks, markets have been falling apart. And it wasn’t just a straight shot down. First they dipped, then bounced, then the bottom fell out.
And in the middle of all that? A whole lot of folks got blindsided.
Because instead of reading what the market was actually saying… they were reading headlines.
Tariffs, Fed jaw flapping, debt markets cracking — everybody had a theory. But the truth is?
Once the market turns bearish, any excuse will do.
That’s why I don’t trade the news. I trade the trend.
I Saw This Coming — And You Could’ve Too
Let me show you something I wrote back in early March, when the indexes were just starting to crack:
“If you’re still trying to buy the dip — STOP!
Because the smart money isn’t playing the upside right now.
They’re playing the downside.”
That wasn’t a prediction. It was a reaction.
Because by then, the market had already given me the signal.
So I flipped bearish — and stayed that way.
Even during that little bounce in mid-March that fooled a bunch of traders? I stuck to the plan. Because the trend was still pointing down.
And guess what? That bounce fizzled, and the real crash came soon after.
It’s Not Magic — It’s Momentum
A lot of people think spotting these turns is some kind of market wizardry… or chart voodoo.
But it’s not.
It’s just a matter of looking at the right things.
Let me break down the exact chart setup I use — the same one I’ve shown you in bullish markets — but now from a bearish perspective.
Here’s what to do:
1. Pull up a 6-month chart of the three major indexes with each candle representing 1 day.
The three tickers you’re going to look at are SPY (S&P 500 ETF), DIA (Dow ETF) and QQQ (Nasdaq ETF)
2. Add three exponential moving averages (EMAs):
- 20-day EMA (short-term) – make it green
- 50-day EMA (mid-term) – make it blue
- 200-day EMA (long-term) – make it red
Here’s what the SPY looked like on a chart with those indicators back when I told you markets had flipped were bearish:
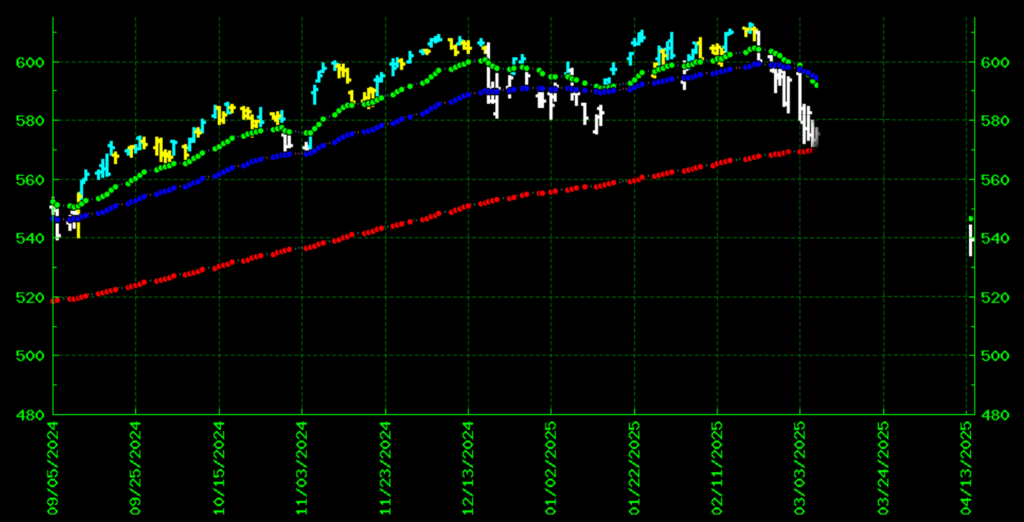
And here’s what ended up happening:
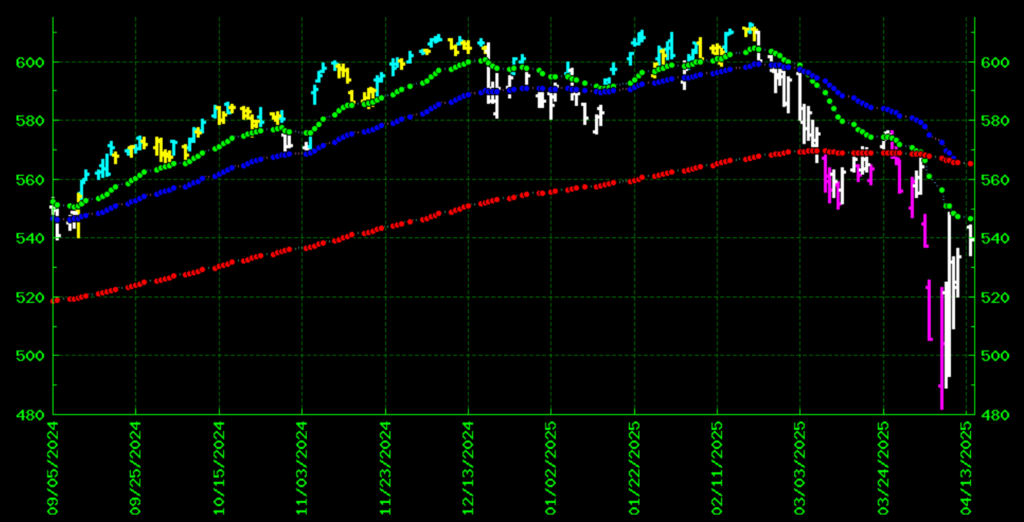
The lesson? When the market is healthy and trending up, the trendlines should stack up like this:
- Green (20-day) on top
- Blue (50-day) in the middle
- Red (200-day) on the bottom
That’s a bullish alignment.
But when the trend flips?
It starts with green falling below blue, and then below red and eventually the whole thing inverts.
Right now green is on the bottom, blue is in the middle and red’s on top.
That’s what you call a bearish stack alignment — and it’s a massive red flag for bulls.
How I Use This Setup in Real Trades
Once I see that bearish alignment?
I switch gears. Well, truth be told, I told you to go bearish as soon as the green was heading below the blue.
But whatever you want to use as your trigger, you need to switch footing when you see the signs add up:
Instead of trying to pick “comeback” trades… Lean into bearish setups:
Stocks already trending down. Ones that are already stuck below resistance.
Then I choose the right strategy — usually bear call spreads — to take advantage of that weakness.
Like this NVDA trade I walked you through last week.
That stock was down, below trend, showing weakness — and even though it popped briefly on news, the strategy held.
Because when you trade with the trend, and you use a strategy that builds in cushion, time, and resistance — even a surprise spike won’t kill you.
Final Thoughts: Let the Chart Be the Boss
Look — the market’s gonna do what it’s gonna do.
You can argue with it… or you can trade with it.
If you’re waiting for the news to tell you it’s safe, you’ll always be late.
But if you train your eyes to read the charts — just those 3 moving averages — you’ll start to see what the smart money sees.
And once you start seeing that?
Trading gets a whole lot simpler.
Forget the noise. Forget the headlines. And for Pete’s sake, forget trying to “guess the bottom.”
Just wait for the signal… and follow it.
Trade well,
Jack Carter
P.S. The Trump Tariffs are kicking one strategy into overdrive. Check it out right here!


