
Hey Traders,
If you’ve been glued to the news the past couple of months, you’d think the market’s gone completely off the rails.
One day, a Trump tweet sends everything soaring.
The next, another soundbite sends it crashing right back down.
Another day it’s tariffs… or GDP or… who knows what?
Quite honestly, it’s dizzying trying to keep up with the headlines.
And to the average investor, it probably looks like chaos.
Unpredictable. Unstable. Maybe even untradable.
But if you’ve been following along with me here — you know better.
Because underneath all that noise, there’s a pattern.
Just look at this chart:
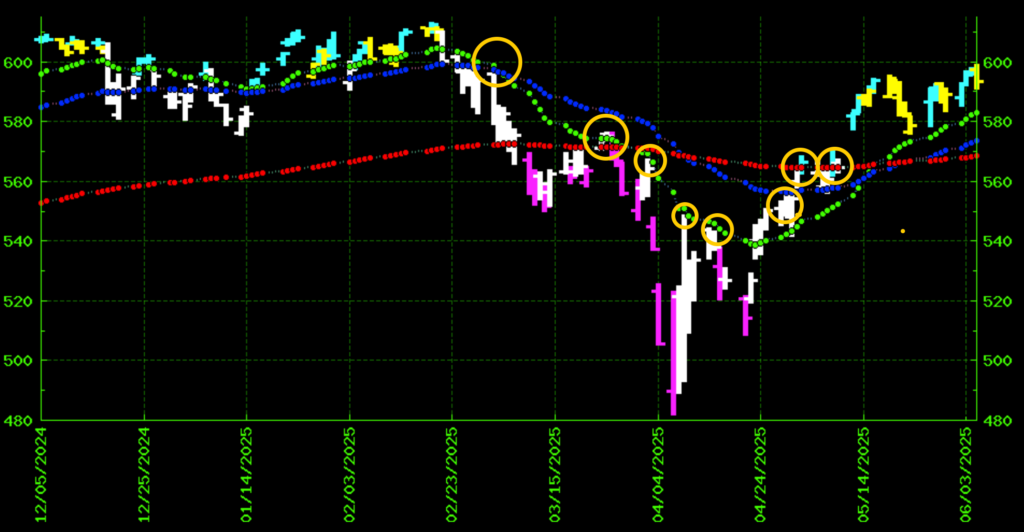
Every yellow circle is a place where, after the price had dropped below trendlines, it tried to rally and was rejected by that overhead resistance.
And now that the price is above those trendlines look and where those trendlines turn into support instead of overhead resistance.
No, we don’t know exactly what Trump’s going to say next… or how the talking heads are going to spin it.
But we do know this:
Markets don’t move randomly. They move in patterns.
That’s why I always come back to the charts.
By layering in a few simple indicators — the 20-, 50- and 200-day trendlines like I’ve shown you — we’ve been able to get a pretty reliable read on where the market’s headed. At least in the short term.
When everyone else is panicking over headlines, we’re tracking momentum.
When they’re chasing reversals, we’re letting structure guide our entries.
I’m not saying it’s perfect. Nothing in trading is.
Everything we do is about stacking the odds in our favors.
But when the market looks like it’s losing its mind… that’s when having a system matters most.
So yeah, the news might be chaotic.
But the charts? They’ve been talking the whole time.
Trade well,
Jack Carter
P.S. Here’s another way to stack the odds in your favor trading one of the most volatile stocks on the market.


