
Hey Traders,
Have you ever driven on a road without lines?
Or maybe during a snowstorm or a heavy rainstorm where the lane markings get buried under all the mess?

If that’s ever happened to you, what did you notice?
You probably found yourself drifting without even realizing it.
Maybe you veered too close to another car… or even started to drift off the road completely!
It’s scary. And it’s dangerous.
And it’s not because you’re a bad driver — it’s because you can’t stay in a lane you can’t see.
You’re flying blind.
And guess what?
The same thing happens when you’re trading without guiderails.
If you just pull up a chart of the SPY over the last few months without any context, it looks like total chaos.
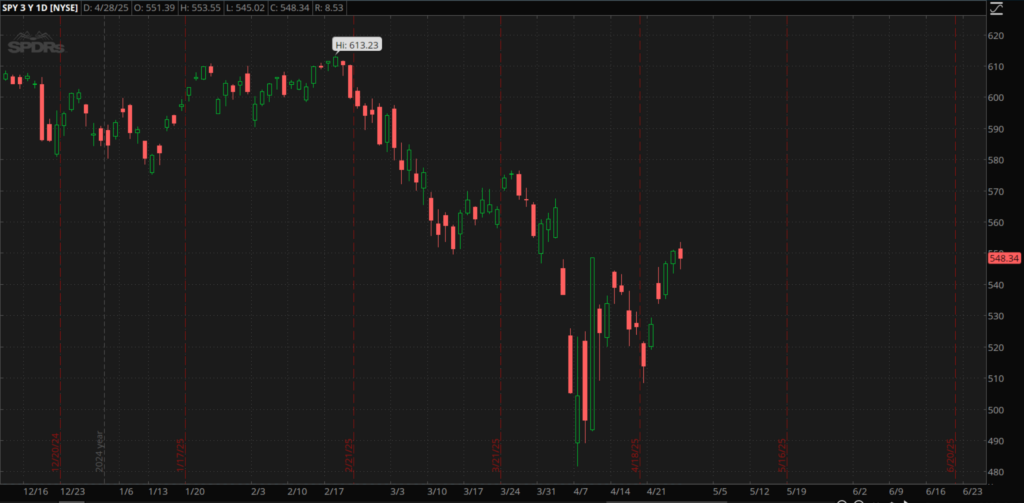
Down… up… down… down some more… up again…
A confusing mess of red and green candles slamming into each other.
No wonder so many traders feel like they’re guessing out there.
But when you lay three moving averages over the chart — the 20-day (short-term), 50-day (mid-term), and 200-day (long-term) like I’ve shown you before — something amazing happens.
The chaos turns into a roadmap.
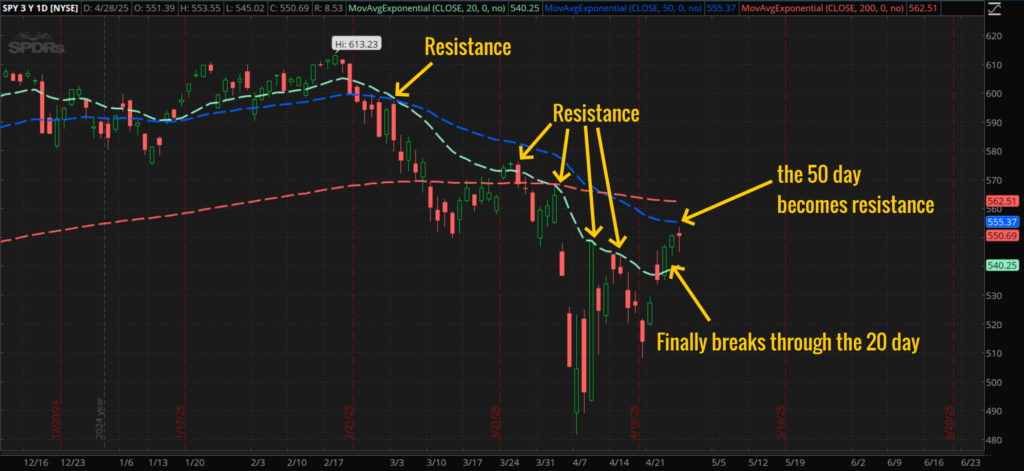
Now you can see it clearly:
- The SPY finds a bottom and tries to bounce — but smacks straight into the 20-day and gets rejected.
- It sinks lower than before.
- It tries again — another bounce, another smack against the falling 20-day line.
- And each bounce is lower and weaker than the last.
Even when we had one of the biggest up days in history a few weeks ago — it’s the big green candle on April 9th, over twice as tall as any other candle on the chart above…
That rally looked strong — until it ran headfirst into the same overhead 20-day moving average… and got crushed back down.
Every move, every turn, every “surprise” — it’s all predictable when you have the right guiderails in place.
What the Market’s Telling Us Now
Fast forward to today:
For the first time in 2 months, SPY has managed to close above the 20-day moving average two trading days in a row last week — Thursday and Friday.
And it looks like it might hold today too.
That’s important… but it’s just step one.
Because we still have the 50-day and 200-day trendlines overhead — and those are major barriers the market will need to fight through if we’re going to see a real, sustainable rally.
Without those moving averages on your chart?
You might be tempted to think “The bottom’s in!” after every green candle… And that would be like drifting into oncoming traffic without even realizing it.
But with those lines?
You can calmly say: “We’re still stuck under resistance. We’re not out of the woods yet.” as you trade accordingly.
Use the Lines. Stay in Your Lane.
I say it all the time, and it’s never been more true:
A market-driven approach beats hope, fear, and guesswork every time.
The market’s not necessarily trying to trick you.
It’s telling you what it’s doing — plain as day — but you’ve got to know how to read the signs.
So the next time you feel like you’re guessing?
Remember the lines. Stick to them. Stay in your lane.
And you’ll be miles ahead of everyone else.
Trade well,
Jack Carter
P.S. Have you seen Lance’s 4pm Payouts? As a former market maker myself, I can tell you this might be the only strategy that gets you on the right side of the market right at the closing bell.


