Today, I’m going to walk you through each of those names and show you exactly how I see them — using the same framework we’ve been talking about for weeks now.
Let’s take a look…
AGI — Breakdown and Gap
AGI recently broke down hard — likely on some kind of news or earnings event.
That big gap you see? It’ll likely need to be filled eventually.
But for now, this chart is clearly bearish now that the price is down below both the green 20 day trendline and the blue 50 day trendline.
This is what a failed trend looks like — and a perfect example of why you don’t try to guess bottoms.
This one is in no man’s land.
BJ — Still Running Strong (But Due for a Pause?)
BJ has been one of our strongest trending stocks lately — and that’s still true.
It’s had four or five blue bar days in a row, which might suggest a short-term selloff or pause is coming.
But overall? This trend still looks bullish, and it’s likely headed over 120.
It’s bullish, but just be smart — don’t chase strength blindly. Let the trend keep proving itself.
FOXA — Finding Resistance
FOXA recently had a bearish crossover and has been failing at the overhead short-term trendline ever since.
This one’s in trouble.
It keeps getting knocked back down every time it tries to bounce — and that short-term resistance is starting to stack up.
Bearish setup.
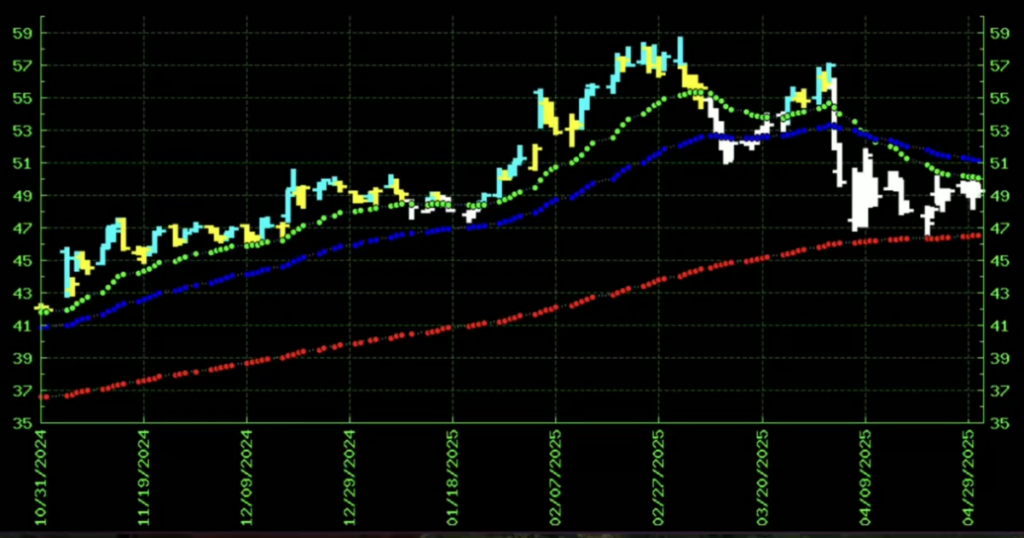
CNP — Surprisingly Strong
This one might surprise you…
CNP has been in an amazing trend, still running strong.
In a market this tough, you don’t expect to find charts this clean — but CNP is holding up beautifully.
Bullish.
GILD — Broken Trend
GILD had a nice run for a while — but that trend has now broken down completely.
The chart is flat now, but if it crosses to the downside, there’s a good chance we see a much deeper drop ahead.
This one has shifted to somewhere between bearish and no man’s land.
VRSN — Bull Market All By Itself
Verisign has been a powerhouse.
If you got in on this one early, you’ve had the chance to ride a beautiful 5-month trend — starting from that bullish crossover back in December.
You’ll notice something interesting, too:
Any time you get a sudden $20–$30 jump, like we see in this chart, that’s often your sell signal.
Same goes when you see multiple blue bars in a row.
This stock’s still bullish, but if you’ve been riding the wave? It might be time to take some profits off the table.
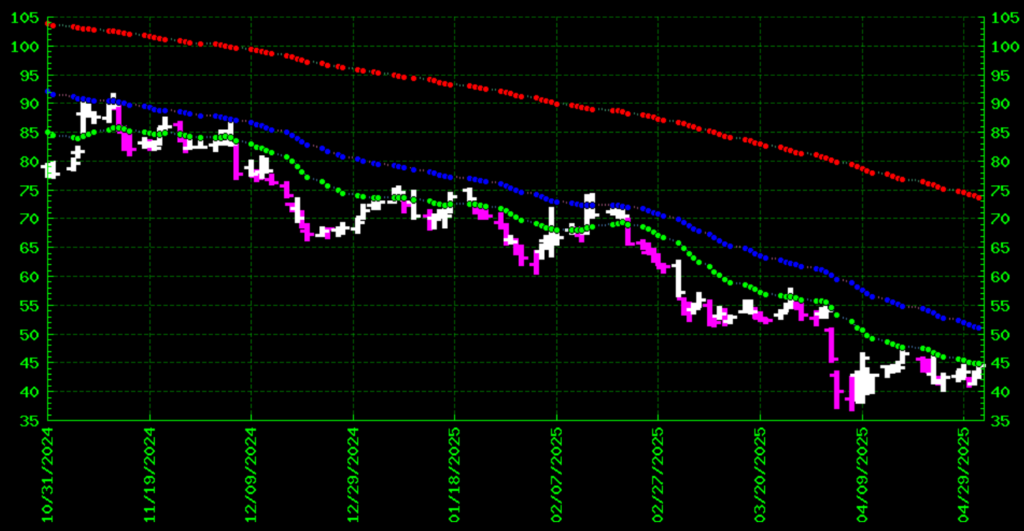
WFRD — From Winner to Watch Out
This one is clearly in a bearish trend and has been since at least October.
And right now, it’s teetering. This is as strong and clear a bearish trend as CNP is bullish.
I’m calling it strongly bearish.
Final Thoughts
So what did we learn?
Even in a tough, range-bound market — you can still find trades.
Some stocks are breaking down. Others are breaking out.
And some, like Verisign and CNP, are flat-out defying gravity.
But the key is this:
You don’t need to guess. You just need to read the chart.
Stick to the framework. Trust the trendlines. And let the chart be the boss.