
It’s Thursday morning and markets are looking really good right now. (UPDATE: Markets dumped off in the afternoon.)
I want you to know that we are in a stock picker’s market.
What I mean by that even though I just said markets are looking good —the broad market is bullish, all 3 major indexes are bullish…
You can’t just randomly go out into the market and pick any stock.
TSLA for example has been dragging down the S&P 500.
So as I say, it’s a stock picker’s market.
And the best way I know to be a stock picker in this market is to follow a plan.
How To Pick Hot Stocks
The best single place to start is with a stock that is making a new 52 week highs.
Your trading platform might give you this. But if it doesn’t there are plenty of free sites you can visit. Here are a list of a few. Try them all out and pick the one that you like best.
- Wall Street Journal – New 52 Week Highs and Lows
- Barchart – 52 Week New Highs
- Yahoo Finance – Recent 52 Week Highs
- Barron’s – New 52 Week Highs and Lows
When I say that, a lot of people cringe. Why?
Because they think that if a stock is hitting new 52 week highs, it means it’s already “come too far”… and how much further can it go?
But that’s not true at all.
Once a stock hits a new 52 week high, there’s what’s called a lack of overhead resistance, which makes it easy for a stock to float higher.
But that’s just the starting point. We’re not done yet.
Here are 5 rules I use to filter down the list and make sure I’ve got a real solid stock before I place a trade:
- The stock must trade on a major exchange (no OTC, or over-the-counter stocks)
- Eliminate penny stocks and crypto-related stocks
- The stock must be $15 to $25 or higher
- Must trade 500,000 shares average daily volume
- The stock must be in a really nice 6 month trend (here’s a detailed piece I wrote on spotting trends)
I use my custom TrendPoint software to find stocks that meet that criteria.
But you can use your trading platform or a free tool like this Finviz scanner to do something similar.
A Picture-Perfect Trend
Want to see what a picture-perfect trending stock looks like?
Take a look at this 1 year chart of Allstate (ALL).
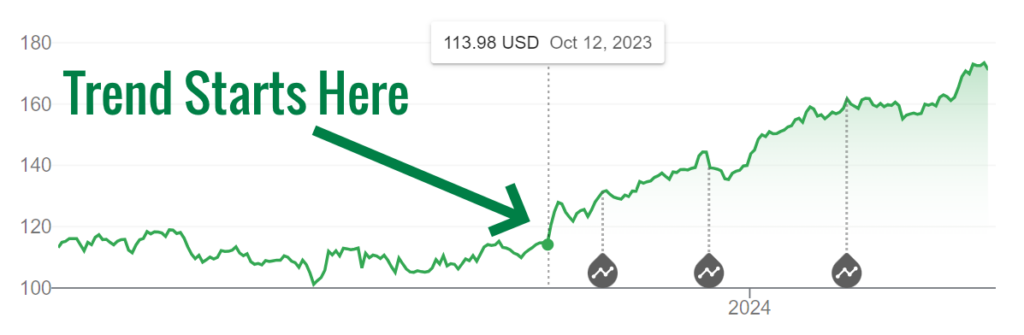
Now, I don’t own ALL and I’m not recommending you buy it.
I’m just using it as an example of what a great trend looks like.
What a beautiful chart.
Once a stock gets going like that, it’s like moving on an already moving train.
Trade It On Auto-Pilot
If you ever wanted to trade a stock like this without having to babysit it, here’s how I do it:
- Buy the stock at the market price
- Set a stop order 7% below your buy price
- Then put in a sell order 10% to 15% higher than your purchase price
If you set the stop and sell order s up as an OCO (one cancels other) order, you can walk away and not worry about it.
If the stock happens to drop a bit, you get out of the trade without much of a loss.
And if it goes up, you’ve got your automatic sell order in while you’re out living your life.
No need to sweat it or stare at charts all day.
While you’re at it, if you buy 100 shares of the stock, you can even sell a covered call against it.
This lets you lower your cost basis while you wait for it to go up. Best of both worlds if you ask me.
I wrote a set of articles about how to do it, which you can read by clicking here.
Trade well,
Jack Carter


