After the turbulence of the last week or so, I want to show you how analyzing the broad market shows me that the trend in the market is potentially changing…
Plus, stay with me, because I’ll be giving you a couple of tickers you’ll want to keep your eye on.
As I’ve talked about many times in the past…
Before I place any trades, I like to gauge the broad market by looking at the SPY, DIA and QQQ with 3 specific indicators on my charts.
This lets me gauge how bullish or bearish the markets are at any given time.
If you haven’t read that other article, I urge you to do that now so you understand what I’m talking about throughout the rest of this market update.
S&P Update
As you can see on my chart here, the S&P has been weak the past few days… It’s not as bullish as it has been.
And as a result, the SPY is sitting right at the short-term, green trendline.
If it falls any further, this could be a point of resistance.
The main takeaway from this chart is that the S&P is not as bullish as it has been up till now.
Dow Update
Next, I look at the DIA to gauge the Dow Jones.
And as you can see on the chart below, it’s below 2 of the 3 trend lines — the short-term, green trendline and the mid-term blue trendline.
As a result, the Dow is no longer bullish. We’re kind of in a no-man’s land.
That’s very important, because it means you can’t just throw darts at a dartboard and pick a winner.
We’re in a stock picker’s market and I’ll touch on that more in a bit.
Nasdaq Update
Finally, I like to use the QQQ to gauge the strength of the Nasdaq index.
And as you can see from this chart, it’s been flat.
Similar to the DIA, it’s not nearly as bullish. You can see that because it’s firmly below the short-term, green trendline.
Gauging The Broad Market
By looking at these 3 ETFs, which track the 3 major indexes, we can see that the broad market is not nearly as bullish as it has been.
They’re definitely not bearish, but they are not bullish.
They’re in a sideways trend, which means we’re in a stock picker’s market.
What Is A Stock Picker’s Market? (and 2 tickers to watch)
A Stock Picker’s Market means we want to pick stocks that are trending better than the broad market.
As I’ve mentioned in this previous video, I’m looking for stocks that:
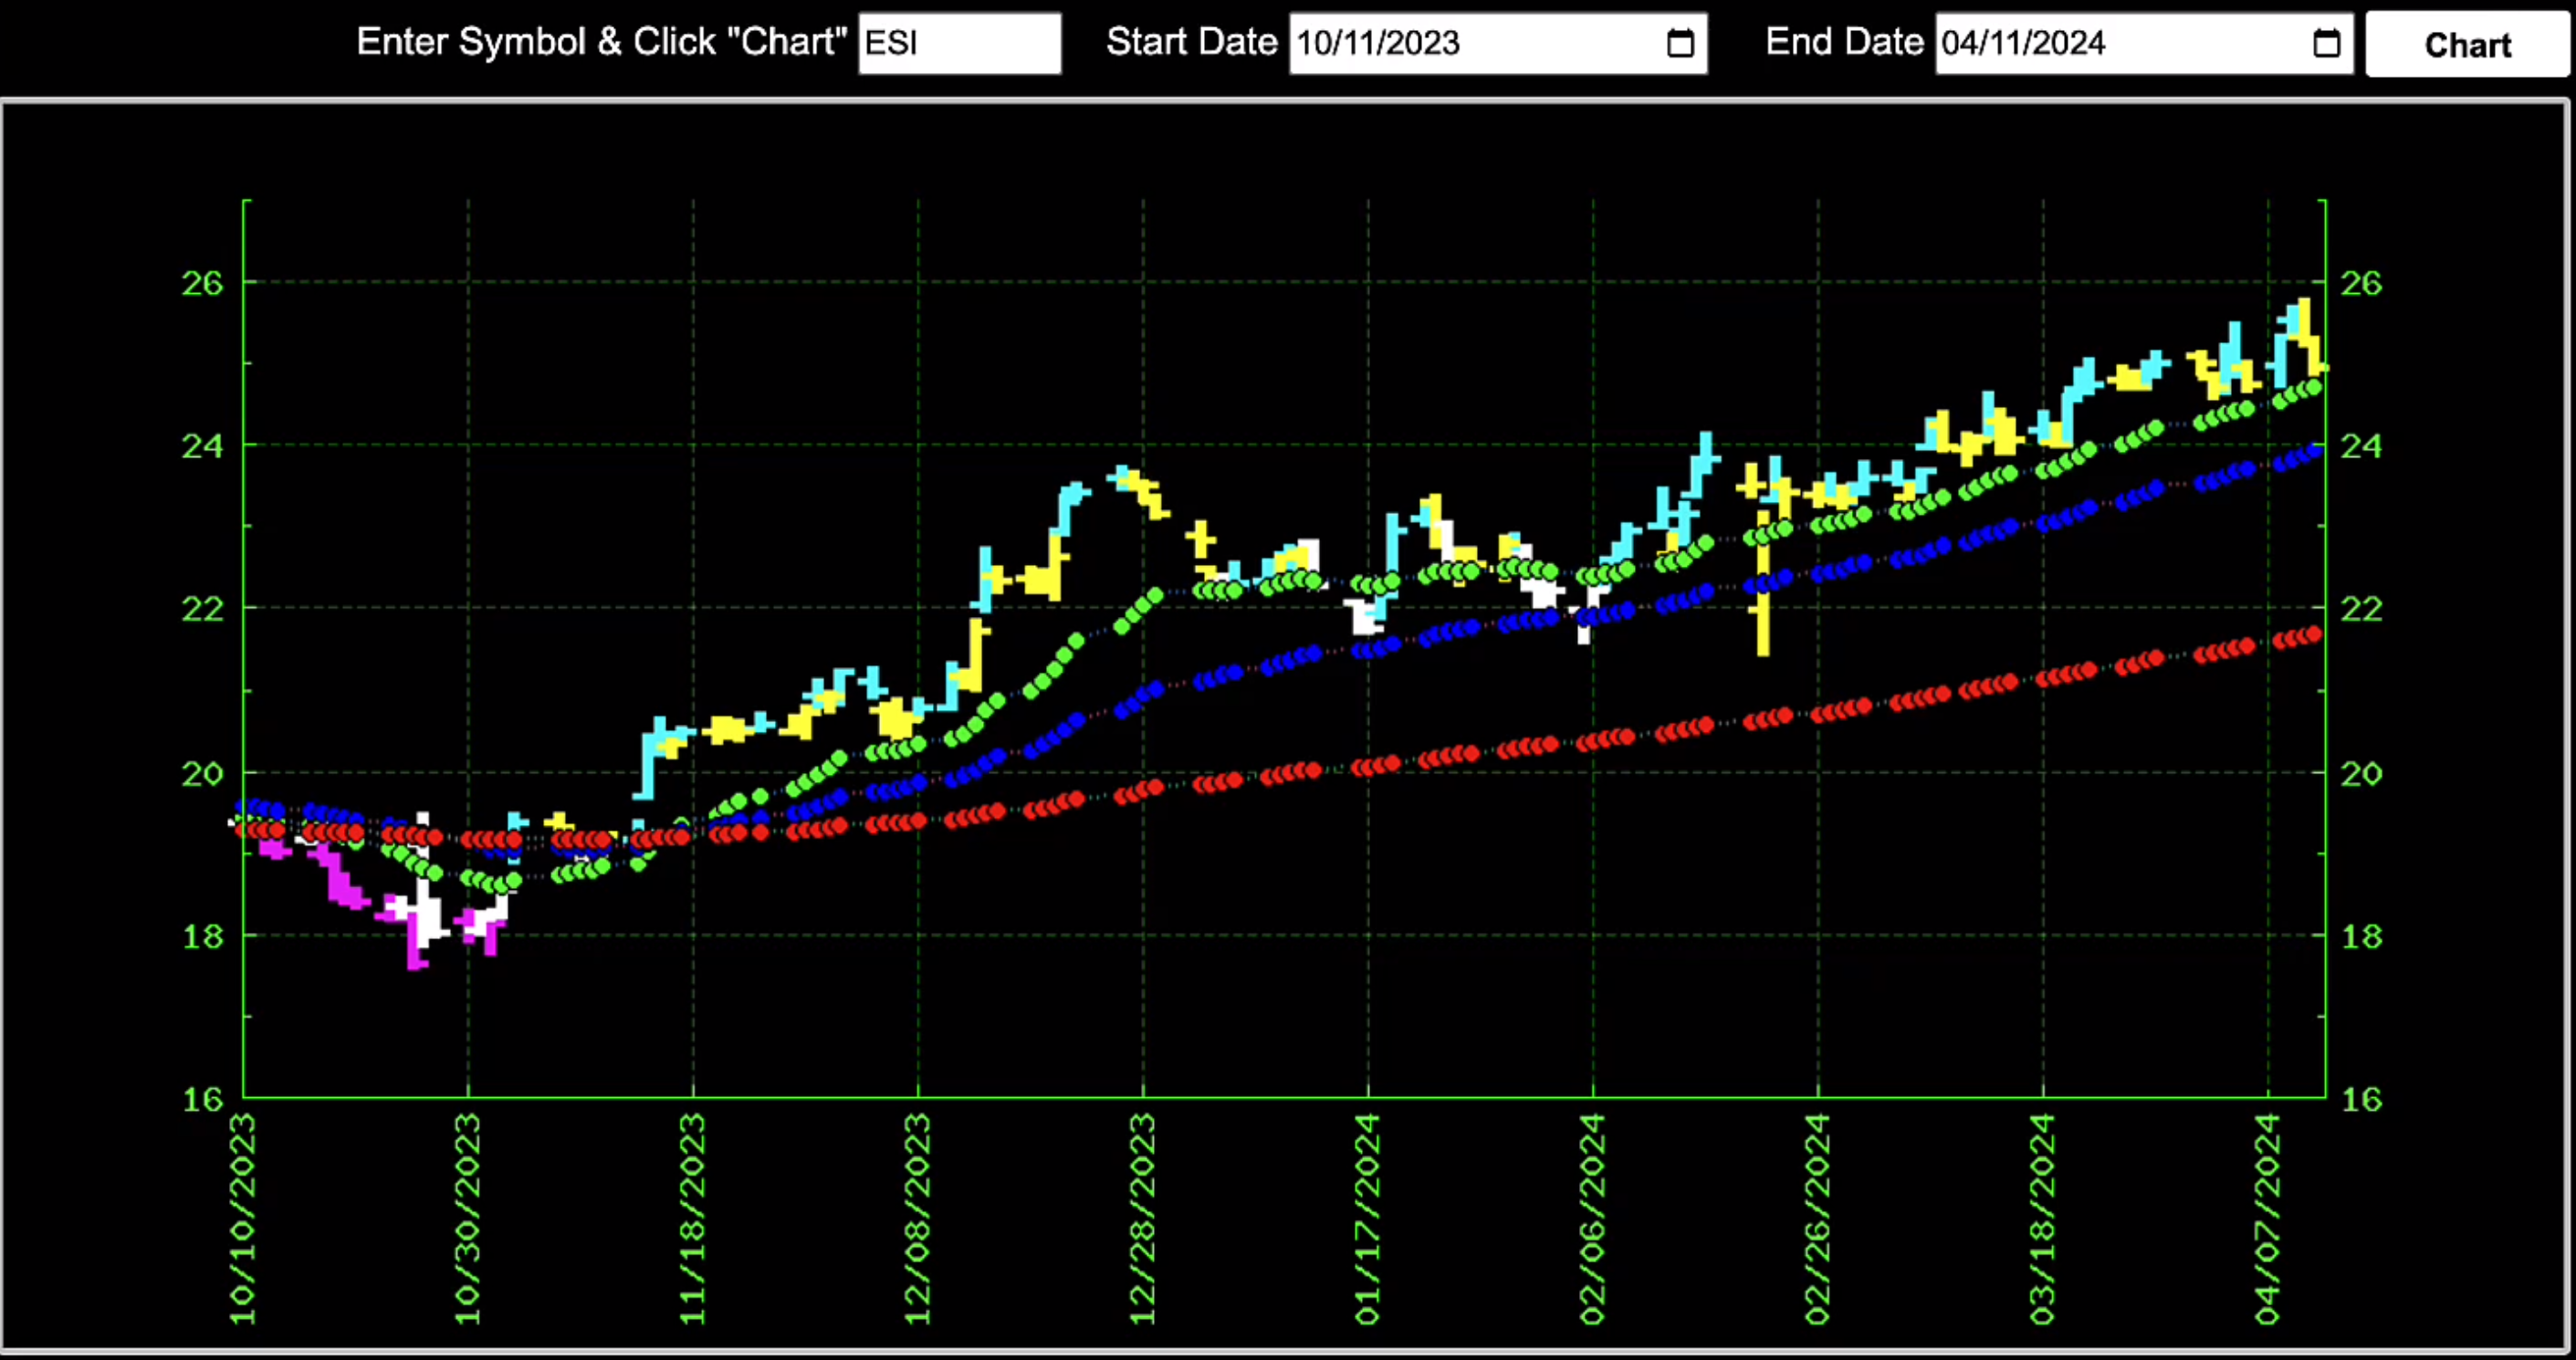
- have made new 52 week highs
- have the support of at least a 6 month trend (longer is better)
As you can see on this chart, ESI is a great example of this:
AMZN is another great one. That’s about as good as it gets right now:
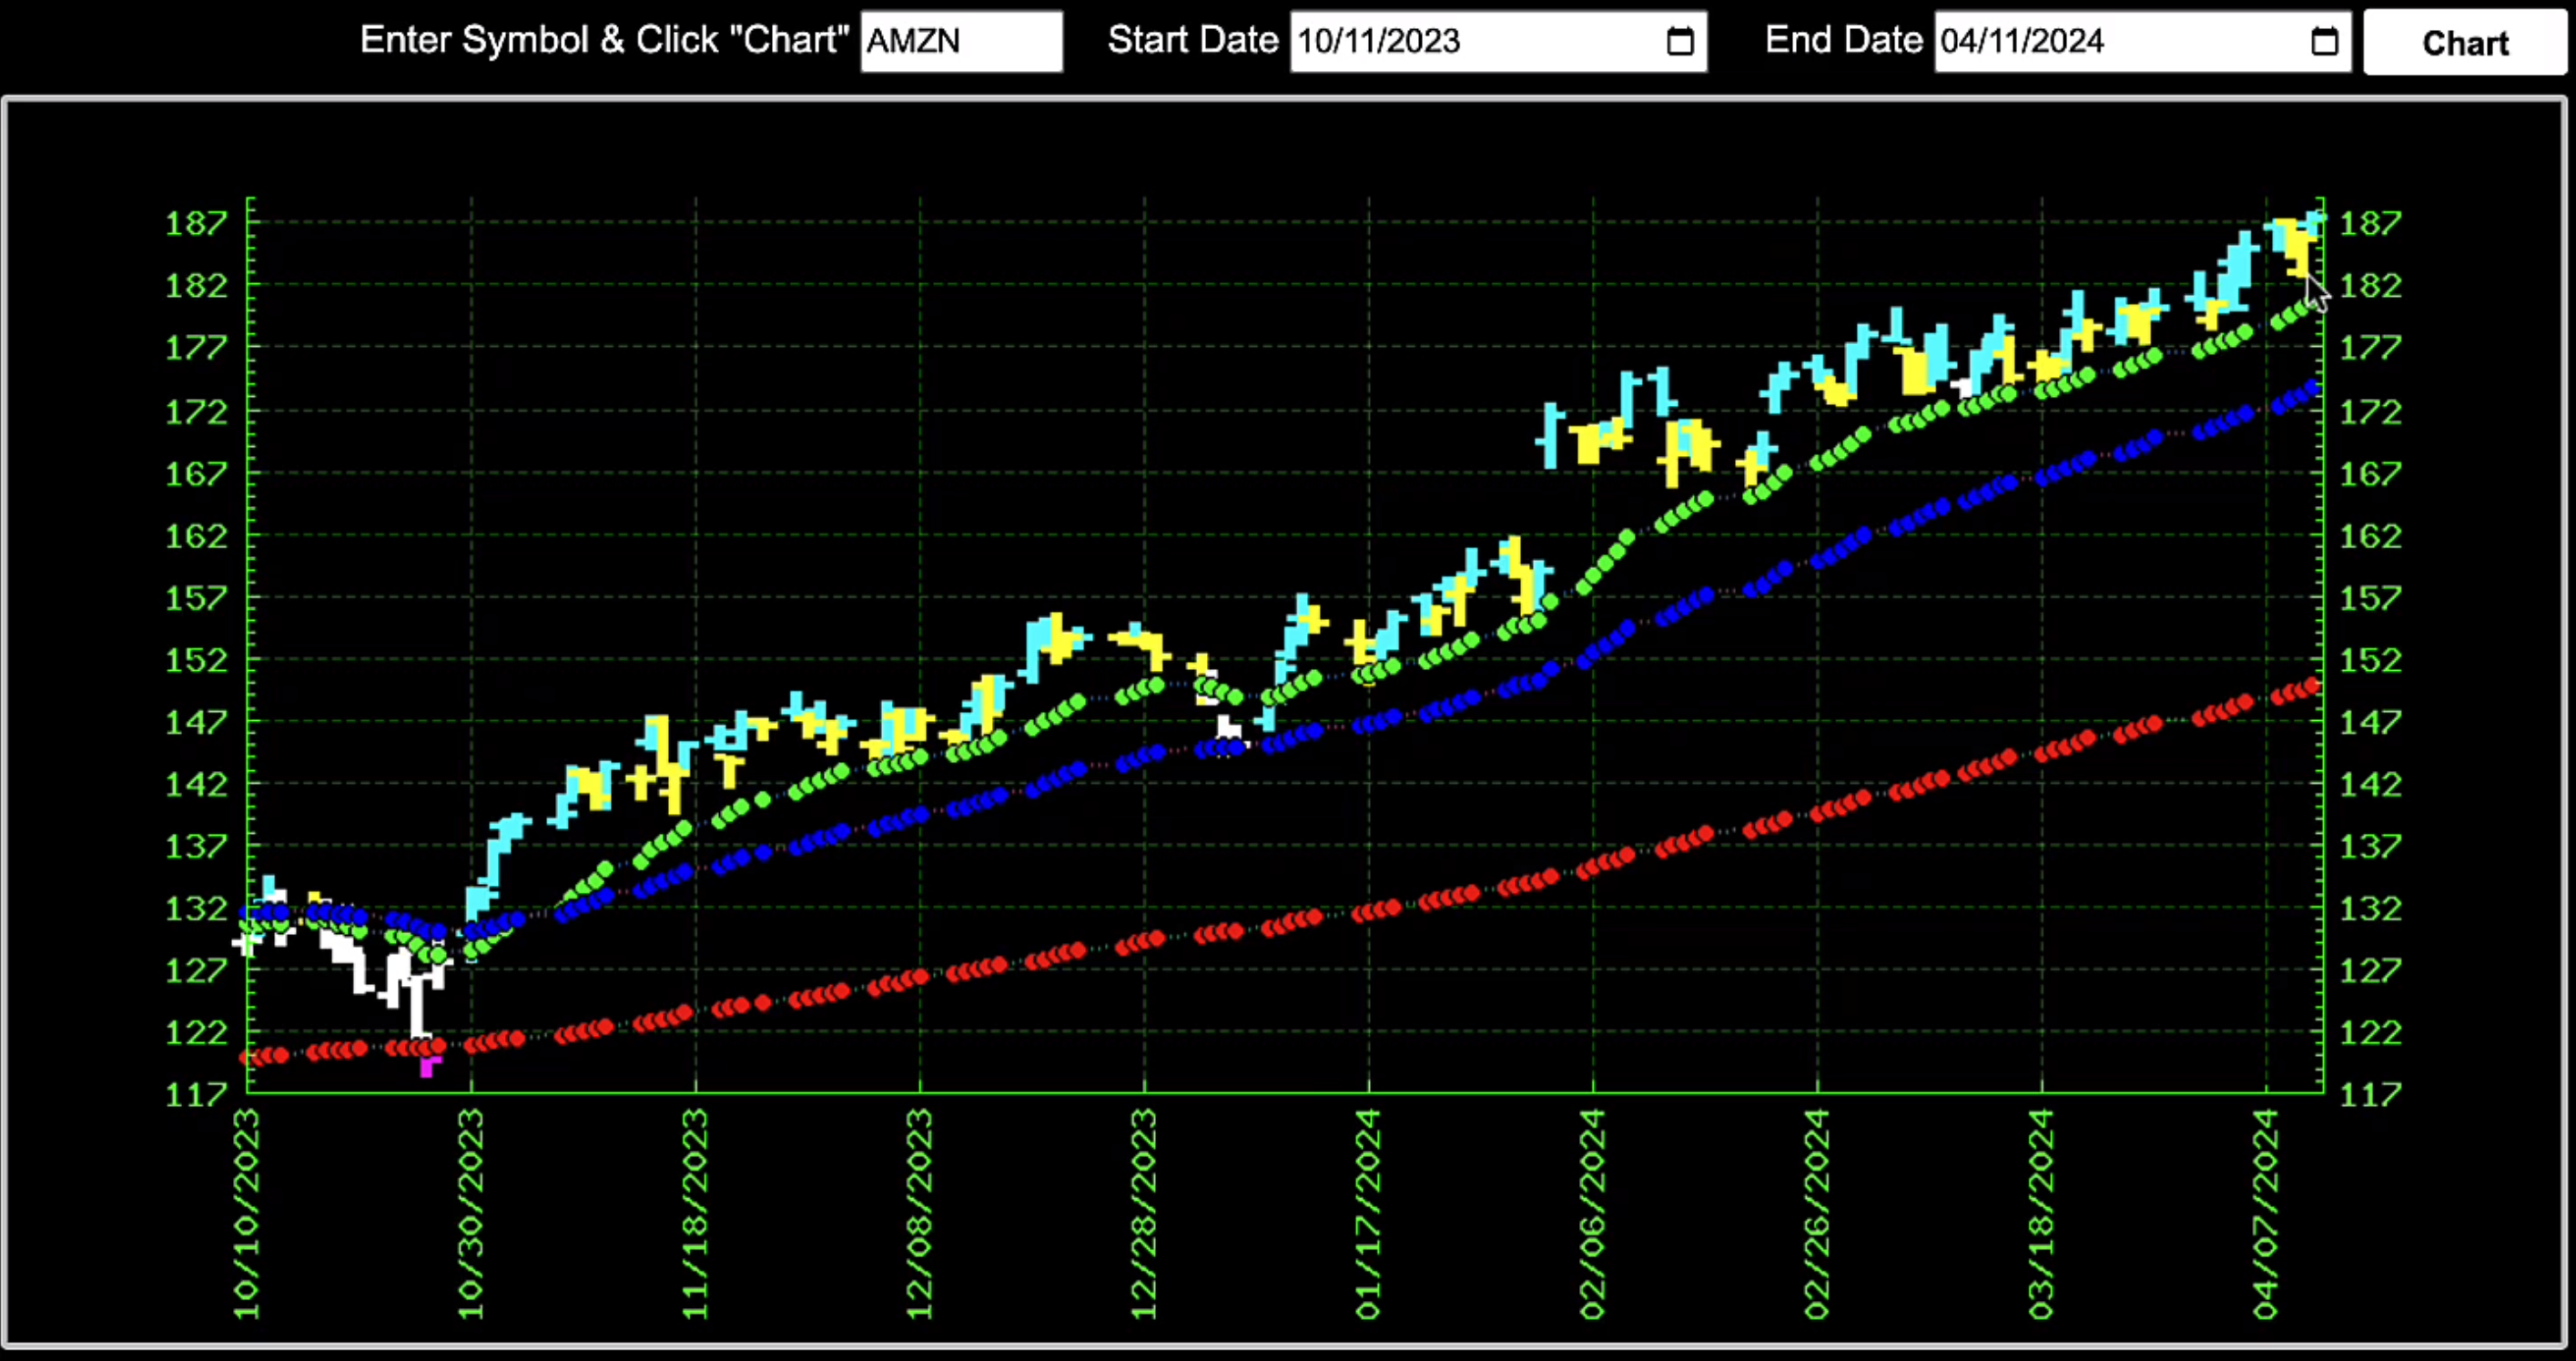
That’s a beautiful trend, almost a full 6 months. This is exactly the kind of stock you want to focus on.
Refining Your Focus, Improve Trading Outcomes
Now that you know the trend might be turning in the broad market…
And that we’re possibly entering a stock picker’s market, you can refine your focus.
Before you place a trade, compare the stock you’re looking at against the broad market and make sure it’s got a nice strong trend.
And don’t forget…
If you’re not already in my FREE Telegram channel, don’t forget to click here to join.
I’ve got exclusive content on there — especially trade ideas — that you won’t get anywhere else.
Trade well,
Jack Carter