I recently shorted AVGO in my Weekly Options Profits paid membership program.
And I’ve been getting a lot of questions about that.
You’ve probably heard me say: “We always trade in the same direction as the broad market.”
And that’s true. It’s a GREAT rule of thumb.
But that’s the thing about rules of thumb. They work MOST of the time.
But sometimes you need to deviate from the usual and do something different…
The First Red Flag
To answer this question, we need to take a look at the tech-heavy Nasdaq using my custom-built TrendPoint software.
We do that by pulling up the ticker QQQ, which is the ETF that tracks the Nasdaq.
If you don’t have TrendPoint, I show you how you can set up a similar kind of chart for free in this post.
This is what QQQ looks like in my TrendPoint software right now:
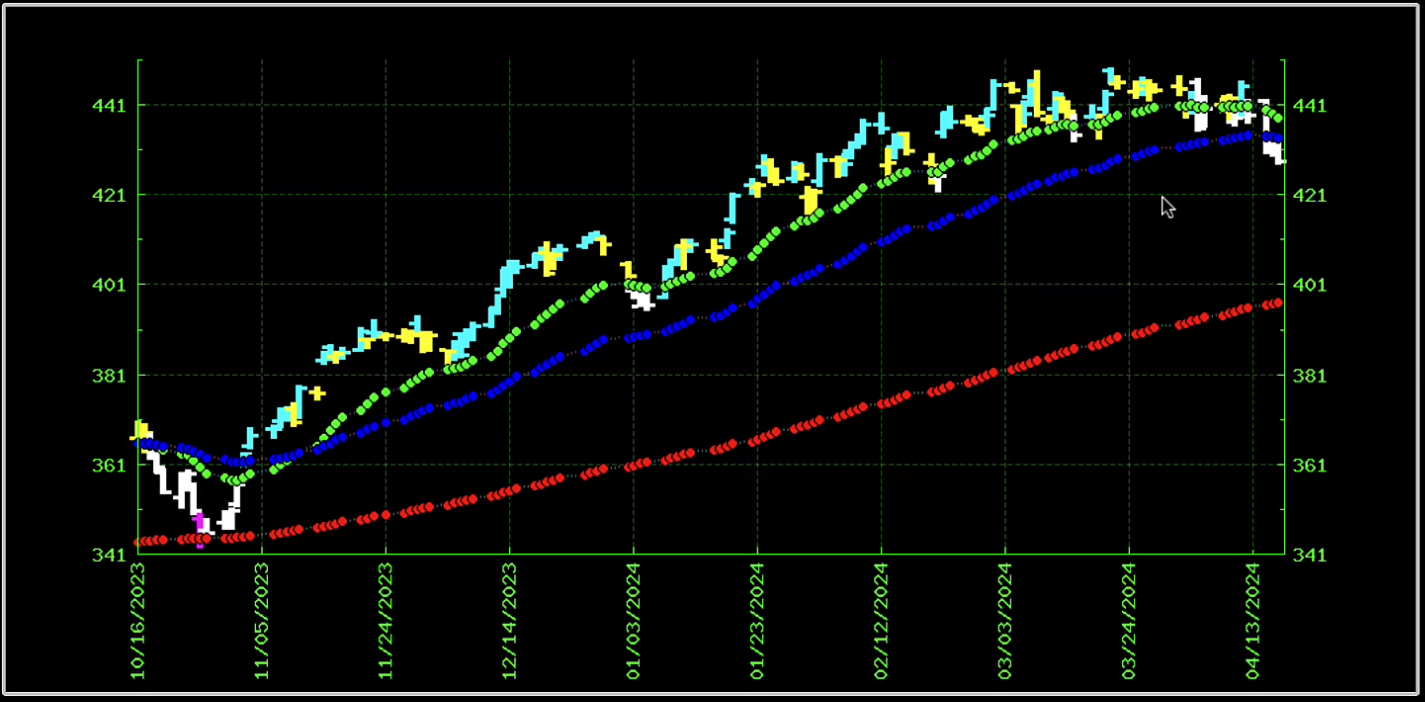
Notice how the QQQ was bullish from November till recently.
The price action was firmly above all 3 trend lines with rare exception.
But if you look towards the right side of the chart, the price action poked solidly through the green, short-term trend line a few times in a row.
And now it’s also gone below the blue mid-term trend line.
This shows is that the QQQ is really cooling off.
It’s not exactly bearish, because it hasn’t established a trend yet. But it definitely isn’t bullish.
That’s the first red flag that things are shifting in the market.
Now that the price action has fallen below 2 of the 3 trend lines, it could fall all the way down to the red long-term trend line.
So there’s a lot more downside in the Nasdaq right now than there is upside.
Another Red Flag
Let me show you something else.
TrendPoint has a feature that shows me which stocks are hitting new highs and which ones are hitting new lows.
Again, if you don’t have TrendPoint, you can get a similar kind of list by going to one of these sites:
- Wall Street Journal – New 52 Week Highs and Lows (scroll down to lows)
- Barchart – 52 Week New Lows
- Yahoo Finance – Recent 52 Week Lows
- Barron’s – New 52 Week Highs and Lows (scroll down to lows)
When I look at my list on TrendPoint, I can count the number of stocks hitting new highs right now on one hand.
There are just 5 of them.
But if we look at the number of stocks hitting new lows… There are more than I can count. Probably 50 or more.
That’s the second red flag that markets are shifting.
But How’s The S&P?
If we look at the S&P 500, which is tracked by the ticker SPY, it’s basically the same story:
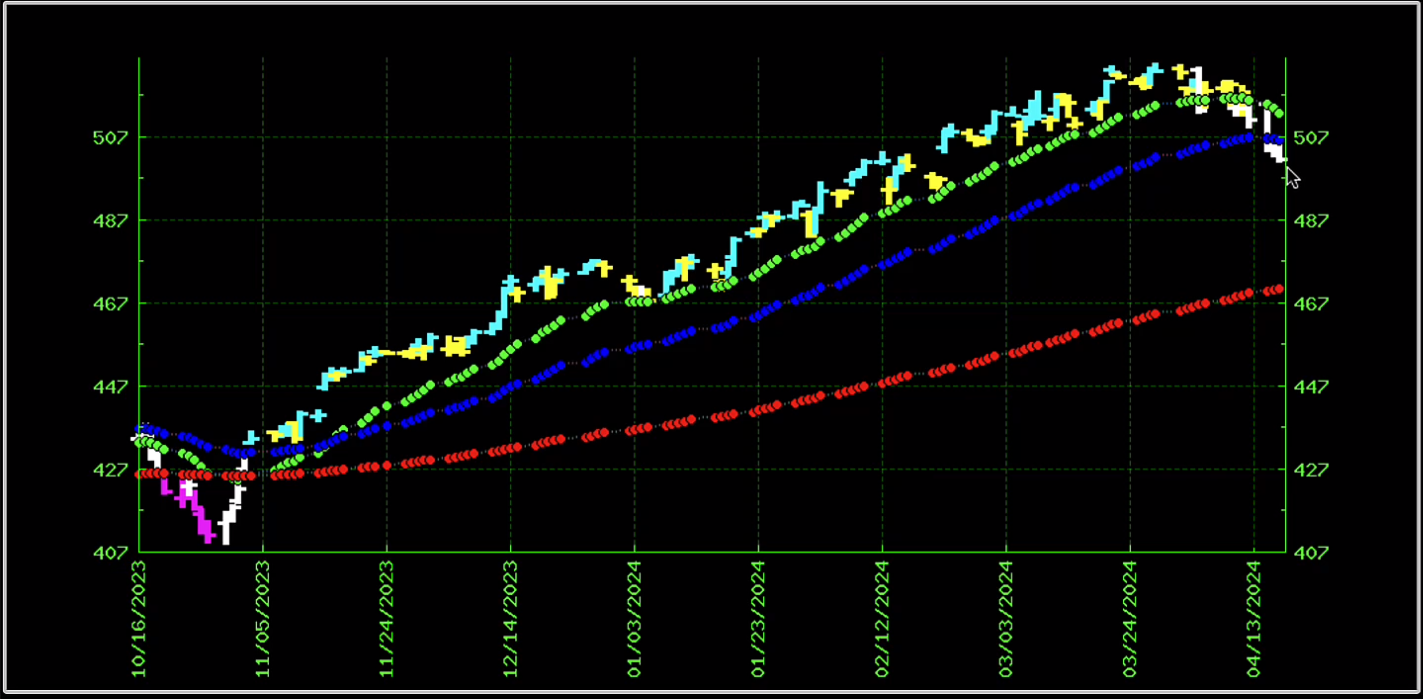
Beautiful bullish trend, bouncing off the short term green trend line from November until recently.
Then we see the price action poke down through both the short-term and the mid-term trend lines.
And The Dow Jones?
Finally, let’s look at the third major index, the Dow Jones, tracked by an ETF that goes by the ticker DIA:
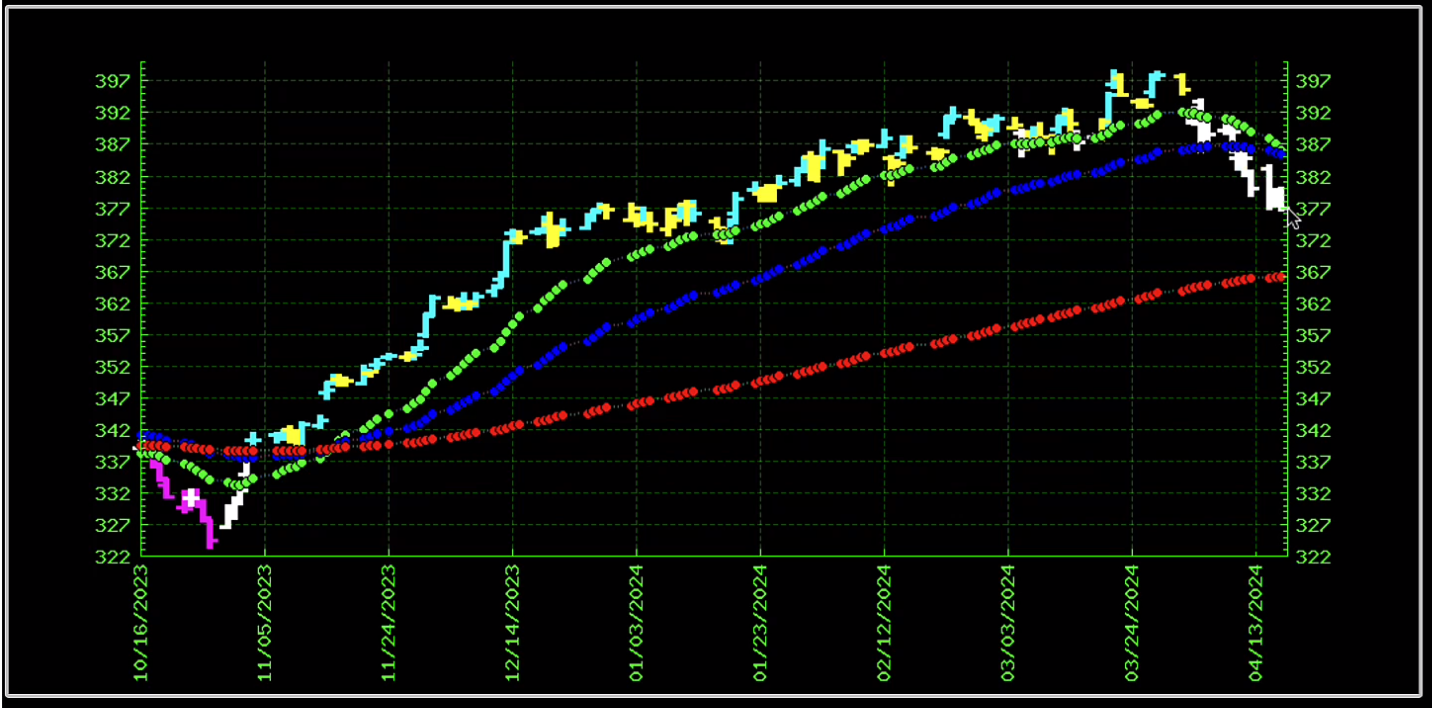
Same story.
Actually worse on this one, because you can see the green short-term trend line is already starting to cross below the blue mid-term trend line.
The Big Picture
By looking at all 3 indexes on a chart that shows short-term, mid-term and long-term trend lines…
We can easily see that markets have shifted DRAMATICALLY in just the past week.
If you’re wondering where things are going next, we don’t need to guess.
The sputtering trends are flashing a red warning sign.
And ultimately, that’s why I shorted AVGO: The trend is your friend, till it ends.
Trade well,
Jack Carter